
What is technical analysis? A beginner’s guide from A to Z
Technical analysis is a way of forecasting where price will go using the market’s own data, mainly price and volume, rather than news or financial reports.
It sounds academic, but at heart it is very down to earth.
Price is where the beliefs, fears and calculations of millions of people meet. Technical analysis is the craft of reading the traces they leave on the chart.
The four groups of tools below make up DCTopTrade’s whole technical series, and each group has its own article that goes deeper.
Three founding assumptions, and why they make sense
- Price reflects everything. Good news, bad news, rumours, even unpublished news that “someone” knew in advance all end up as buying and selling, and all of it shows up in price. So instead of chasing the news, a technical analyst reads the combined result of every piece of news directly: the chart.
- Price moves in trends. A trend in progress is more likely to continue than to reverse, because the crowd trades on momentum and large flows of money need a long time to build or unwind positions. “Trend is your friend” rests on that same behaviour, so it is more than an empty slogan.
- History repeats itself. More precisely, human psychology repeats itself. The fear of losing money and the greed of 2026 are no different from those of 1990, so the price patterns that reflect that psychology keep coming back too.
Technical vs fundamental: not enemies, two different questions
Fundamental analysis answers the question “WHAT to buy or sell, and WHY”: interest rates, GDP, monetary policy. Our economic news section serves that question.
Technical analysis answers a different one: “WHEN to enter, and WHERE to put the stop”.
Professional traders use fundamentals to pick a side and technicals to pick a point. Arguing over which school is right is a beginner’s game.
People who make money use both, like a pair of hands.
The four core tool groups: a map of the series
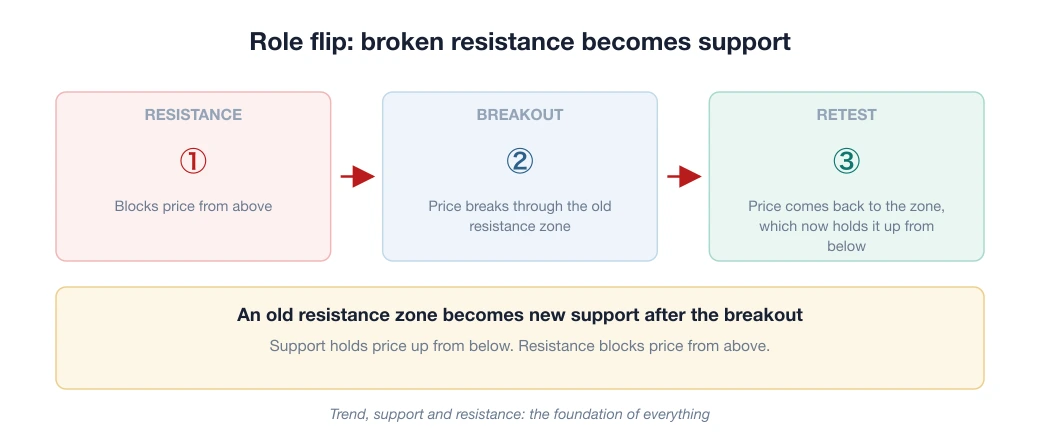
1. Trend, support and resistance: the foundation of everything
An uptrend is a series of higher highs (HH) and higher lows (HL).
Join the lows and you have a trend line. Price zones that have reversed several times become support, which holds price up from below, and resistance, which blocks price from above.
Those three plain ideas are enough to read a chart before you add any indicator.
Beginners often skip them and rush into flashy indicators. That is learning in the wrong order.
2. Candlestick and chart patterns: the language of the crowd
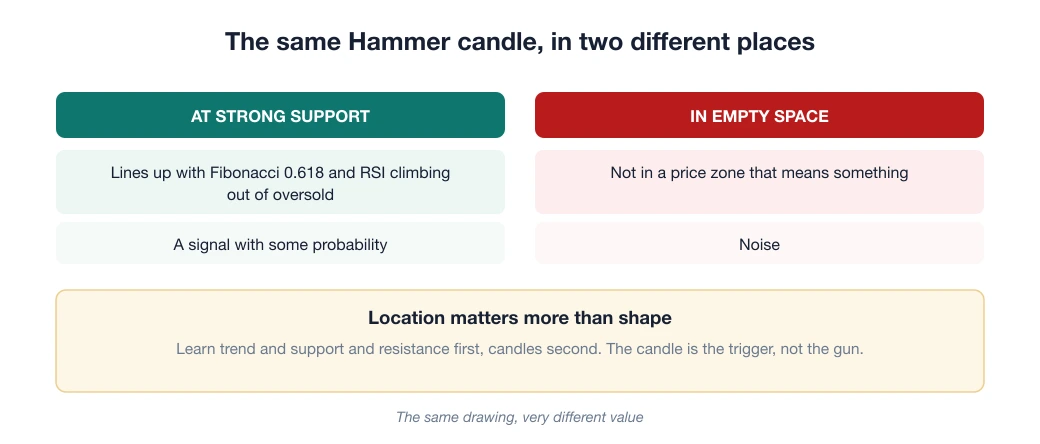
Japanese candlesticks read the psychology of ONE session (hammer, doji, engulfing…); chart patterns read a longer story (head and shoulders, double top, triangle…). Both only mean something at an important location: a hammer candle in empty space means nothing, while a hammer right at strong support is a signal.
3. Indicators: a measuring tool, not a crystal ball
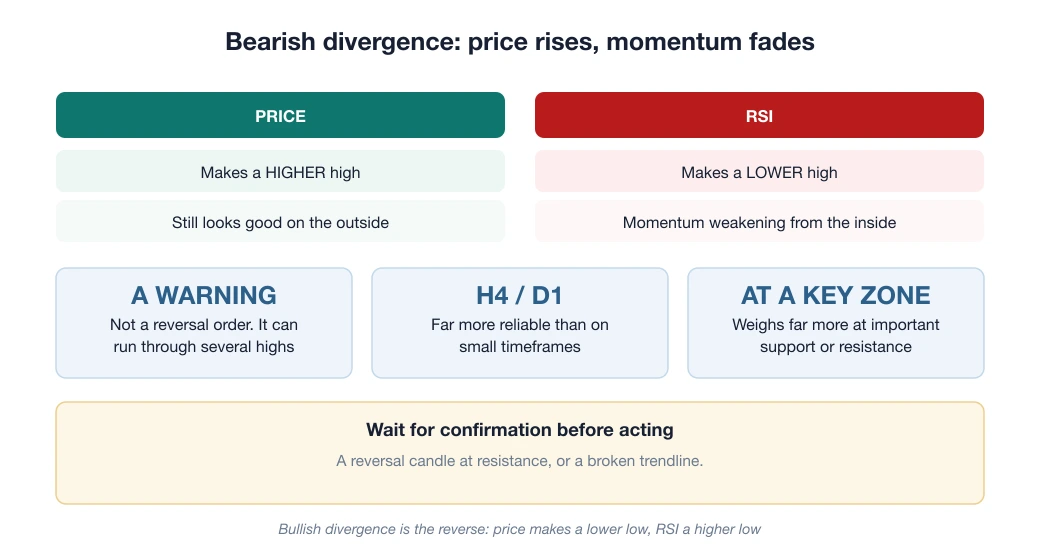
RSI measures the strain behind rises and falls. MACD measures changes in momentum. Bollinger Bands measure volatility.
What beginners often get backwards is that indicators are calculated from past prices.
They describe what has already happened so that you can weigh the probabilities. They do not predict the future.
Two or three indicators that measure different things beat seven indicators that all measure the same thing.
4. Measuring tools: Fibonacci and the “natural” zones
Fibonacci retracement helps estimate where a price swing may pull back to. There is no magic in it: it works partly because enough people watch the same price levels and act the same way (a self-fulfilling effect).
An 8-week plan, 20 minutes a day on one currency pair
- Weeks 1–2: learn only to identify the trend and draw support and resistance on the D1/H4 charts of ONE pair (EUR/USD). Spend 20 minutes a day, take a screenshot when you finish, and at the end of the week compare it with what actually happened.
- Weeks 3–4: add Japanese candlesticks at the zones you have drawn. The rule: only count candle signals that APPEAR AT support or resistance.
- Weeks 5–6: add ONE indicator (suggestion: RSI) as a filter. Start trading on demo or on a Cent account at minimum size, worked out with the formula risk ÷ (stop loss × pip value).
- Weeks 7–8: combine everything into a fixed entry checklist (for example: uptrend + price back at support + confirming candle + RSI leaving oversold → enter; one condition missing → stay out). Keep a journal of every trade. From here on your job is to repeat and keep statistics, not to hunt for a new “holy grail”.
Are chart-drawing livestreamers worth learning from?

This question comes up again and again, and it has no single answer.
But one test works with anyone: ask to see the history of closed trades, not screenshots of charts that have already been drawn.
A line drawn after price has moved is always right. A closed trade has a date and time, a size and a result, and it cannot be edited.
The three mistakes below explain why a nicely drawn chart and a profitable account are two separate things.
Three mistakes that wipe out beginners fastest
- Stacking 7 indicators on one chart: the signals turn to noise, analysis freezes, and you get a false sense of being “scientific”. A few indicators understood deeply beat many understood shallowly.
- Changing system after every losing streak: every system has losing streaks, and its value can only be measured over 50–100 trades. Keep changing and you stay at trade number 1 forever.
- Right analysis, account blown by position size: technical analysis picks good entry points, but survival is the job of money management (risk 1–2% per trade; see what a lot is). Good technique plus careless capital still blows up the account.
Week 1 starts today: open the EUR/USD D1 chart, draw the two support and resistance lines nearest to price, and take a screenshot. By week 5, read about RSI, the first indicator we recommend learning.
Frequently asked questions
Should beginners learn technical or fundamental analysis first?
Start with technical analysis, because it is visual (you look at a chart) and helps you build entry and exit discipline straight away. Once you are solid, add fundamental analysis to understand the macro backdrop that moves price.
Is technical analysis alone enough to trade profitably?
Many traders use only technical analysis and still make a profit, but the deciding factor is not a “magic indicator”. It is money management, discipline and a sensible ratio of reward to risk. Technical analysis is only a tool for improving your odds.
What is the minimum set of indicators for a beginner?
You do not need many. One momentum indicator such as RSI or MACD, plus reading the trend and support and resistance, is enough to start. Piling on indicators often leads to “analysis paralysis”.
Spotted something inaccurate? Tell us and we will check it and publish a correction.