
What are Japanese candlesticks? Six patterns worth learning
Japanese candlesticks, developed by Japanese rice traders in the 18th century and popularised in the West by Steve Nison, are a widely used way of displaying price.
The reason: each candle tells the whole psychological story of one session in a single shape.
The six patterns listed below are ones you will meet often. The same pattern can be a signal or noise, depending on where it appears.
Anatomy of a candle: the whole thing in 30 seconds
Each candle has a body (the range between the open and the close) and wicks (the upper and lower shadows, marking the session’s high and low). A green candle closes above its open (buyers won the session); a red candle is the reverse.
That gives you the basic grammar: a long body means the winning side dominated; a long wick means the losing side once had the upper hand and was pushed back. Reading candles comes down to fitting those two statements into their context.
The six patterns, read as a story of buyers and sellers
- Doji, open ≈ close, long wicks on both sides: the two sides fought all session and it ended in a draw. At heart it is an ellipsis, and on its own it does not signal a reversal. A Doji after a long run up, at resistance (a price zone where rallies have stalled before), is the one worth noticing.
- Hammer, a small body sitting at the TOP, a lower wick at least 2 times the body, appearing AFTER a move down: sellers pushed price deep during the session, but buyers dragged it back up near the high. The story: selling pressure is running out. The same shape after a move up is called a Hanging Man, and it means something quite different. Location decides both the name and the meaning.
- Shooting Star, the mirror image of the Hammer: a small body at the BOTTOM, a long upper wick, after a move up. Buyers pushed price high and sellers knocked it back down: the rally is being rejected at that price zone.
- Bullish Engulfing, a small red candle followed by a large GREEN one that “swallows” the whole body of the candle before, after a move down: buyers halted the decline and then turned the picture around completely within one session. A reversal signal worth watching when it stands in the right place.
- Bearish Engulfing, the reverse version: a small green candle, then a large RED one covering it, after a move up.
- Morning Star, a set of three: a long red candle (sellers in control) → a small candle (indecision) → a long green candle closing deep into the red body (buyers take back control). The classic three-session bottom reversal; its counterpart at a top is the Evening Star.
Rule number one: location matters more than shape
A candle pattern only means something when it sits in a price zone that means something.
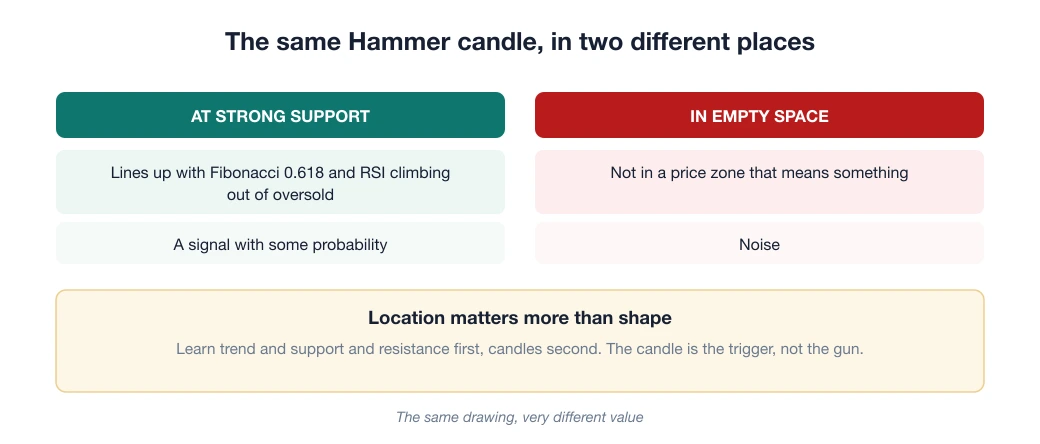
A Hammer in the middle of empty space is noise. A Hammer right at strong support, lining up with the Fibonacci 0.618 level and with RSI climbing out of oversold, is a signal with some probability behind it.
The same drawing, very different value. So the right order to learn is: trend plus support and resistance first, candles second. The candle is the trigger, not the gun.
Trading with candles: a practical three-step frame
- Mark your hunting zone: support and resistance, a Fibonacci zone, the edge of the Bollinger Bands. Draw them BEFORE the candle forms.
- Wait for a confirming candle in the zone: a Hammer or Bullish Engulfing at support to buy; a Shooting Star or Bearish Engulfing at resistance to sell. Wait for the candle to CLOSE. A pattern only counts once the session ends, and a candle still forming can change shape at the last minute.
- Set the stop loss from the candle itself: buying on a Hammer → stop below the bottom of the wick; selling on a Shooting Star → stop above the top of the wick. The pattern hands you a natural invalidation point. Use it, and size the position with the formula risk ÷ (stop loss × pip value).
Three common candle-reading mistakes
- Counting candles on too small a timeframe: patterns on M1–M5 (one- to five-minute charts) are so noisy they are close to meaningless; H4/D1 (four-hour and daily charts) is where candles “tell the truth”.
- Learning too many patterns: the 6 in this article plus their variants are enough for a whole career; 50 patterns only create the illusion of expertise.
- Skipping the confirming candle: seeing a Doji at a top and going short straight away. A Doji only says “undecided”; wait for the next candle to pick a side, then follow it.
Open a daily chart of any pair and count how many of the six patterns above appeared last week, and how many of them landed right on a support or resistance zone. When dozens of candles combine into a larger shape, that is a chart pattern: head and shoulders, double top, triangle.
Frequently asked questions
Which candlestick pattern is the most reliable for beginners?
Bullish/Bearish Engulfing and Hammer/Shooting Star are easy to recognise and reliable when they appear in the right place (a support or resistance zone). A beginner should get these few patterns down first instead of trying to learn every pattern there is.
What does a Doji candle signal?
A Doji shows balance, indecision between buyers and sellers (the open and close are almost equal). On its own a Doji is neutral, but when it appears at the top or bottom of a trend, or at a strong resistance or support zone, it often points to a possible reversal, and you need to wait for the next candle to confirm.
Should I enter a trade as soon as I see a reversal candle pattern?
No. A candle pattern is only a reference signal. Wait for the next confirming candle, check the location (is it at a support or resistance zone?) and combine it with an indicator such as RSI or MACD. Always set a stop loss, because any pattern can fail.
Does reading Japanese candlesticks work for forex, stocks and crypto?
Yes. Japanese candlesticks reflect buying and selling psychology, so they apply to any market with a price chart: forex, stocks, commodities and crypto. The principles for reading the body and the wicks are the same.
Spotted something inaccurate? Tell us and we will check it and publish a correction.