
What are Bollinger Bands? How to use them (2026)
John Bollinger created Bollinger Bands in the early 1980s. Think of them as a stretchy jacket wrapped around price.
The middle line is a 20-period simple moving average (SMA 20). The upper and lower bands sit 2 standard deviations away from it. Standard deviation measures how much price swings, so the bands widen on their own when the market is busy and contract when it goes quiet.
The signals below all come from that widening and contracting.
Three parts, one principle
- SMA 20 (the middle line): the “consensus average price” of the last 20 sessions, and also a level that price often retests during a trend.
- Upper/lower band = SMA ± 2σ (two standard deviations): statistically, about 95% of “normal” movement stays inside the bands. Price touching or breaking a band means volatility is at an extreme, but an extreme does not automatically mean a reversal, and this is where many people get it wrong.
The costly misconception: “sell at the upper band, buy at the lower band”
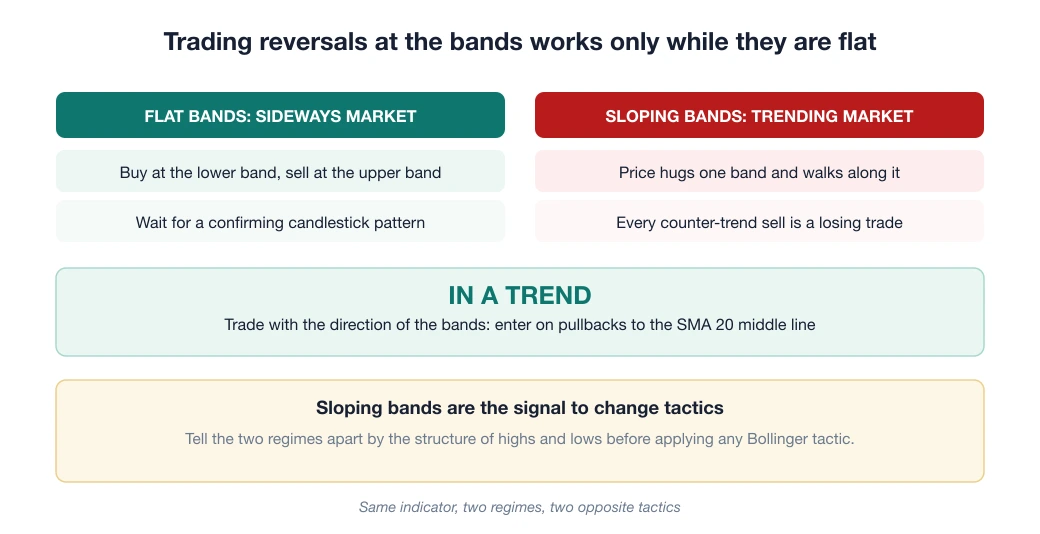
It sounds logical, and it does work, but only in a sideways market.
In a strong trend something else happens: the band walk. Price hugs the upper band, or the lower one, and slides along it for dozens of sessions.
Every touch of the band looks overbought. And every counter-trend sell is a losing trade.
A band walk is not a sell signal. It is evidence of a very strong trend. The practical rule:
- Sideways market (flat bands, price bouncing between the two edges): you can trade reversals at the edges, buying the lower band and selling the upper band, with a confirming candlestick pattern.
- Trending market (sloping bands, price hugging one edge): trade WITH the direction of the bands. Good entries are pullbacks to the SMA 20 middle line that then bounce on.
Tell these two regimes apart by the structure of highs and lows (see the introduction to technical analysis) before applying any Bollinger tactic.
The squeeze: unusually narrow bands signal exhausted volatility
When the bands squeeze unusually tight, volatility has dried up. The market is like a compressed spring, and long stretches of low volatility usually end in a sharp breakout. How to trade a squeeze with discipline:
- Spot it: the distance between the two bands is the narrowest in roughly the last 100 sessions (judging by eye is enough, no extra indicator needed).
- DO NOT guess the direction. A compressed spring does not tell you whether it will snap up or down. Set price alerts at both bands and wait.
- Enter on the breakout: a candle that CLOSES outside a band while the bands start to widen means the move has started. Watch for the false breakout (head-fake) that John Bollinger himself warned about: price pokes out of one band, then whips round and runs to the other. So wait for the candle close plus widening bands, and do not chase a candle that is still forming.
- Put the stop loss on the opposite side of the squeeze zone; the minimum target equals the width of the whole consolidation phase.
Pairing it with RSI: the classic combination
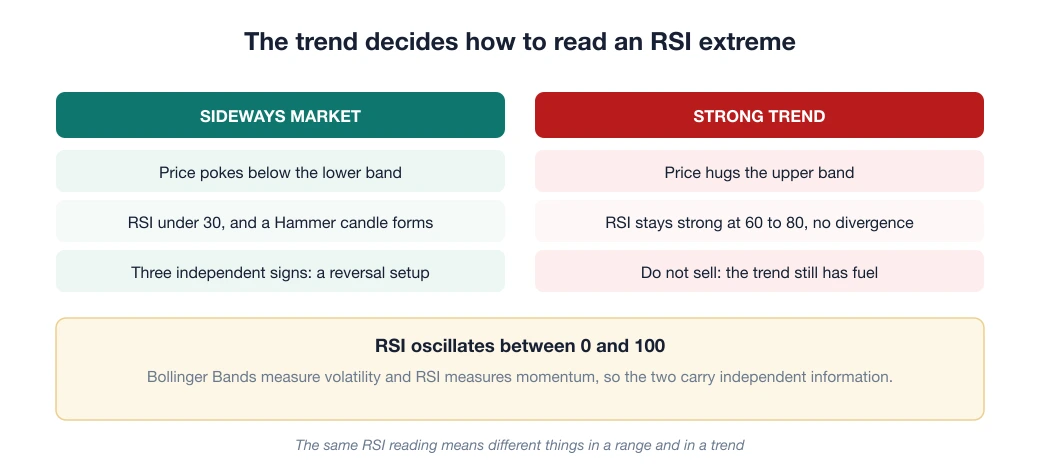
Bollinger Bands measure volatility, while RSI measures momentum. The two carry independent information, so they combine well.
Take a reliable reversal setup in a sideways market: price pokes below the lower band, RSI is under 30, and a Hammer candle forms. Three independent pieces of evidence point the same way.
On the other hand, if price is hugging the upper band while RSI stays strong, meaning between 60 and 80 with no divergence, do not think about selling. The trend still has fuel.
Settings and habits
- Keep the standard settings (20, 2) as they are, because their value lies in the whole market watching the same thing.
- H4 and D1 timeframes give clean signals; on small timeframes the bands jerk around constantly.
- Keep a squeeze journal: each time you see the bands contract, note it and follow the breakout that comes after. After 20 examples you will have a feel for when a squeeze is “ripe” that no book can teach you.
The last piece of the toolkit: when these candle structures and swings stretch into larger shapes, you are looking at chart patterns, the next article in this series.
Frequently asked questions
What settings should Bollinger Bands use?
The default is a 20-period average (SMA 20) and 2 standard deviations, as recommended by John Bollinger, and it works on many timeframes. Beginners should keep the default rather than over-optimise it.
What does a Bollinger squeeze signal?
When the two bands narrow close together (a squeeze), the market is in low volatility and consolidating, which often signals that a price breakout is coming. Traders wait to trade in the direction price breaks out of the squeeze.
Should you sell when price touches the upper band and buy at the lower band?
Only in a sideways market. In a strong trend, price can “hug the band” for a long way, so mechanically selling and buying at the bands will lose. Consider the trend context and combine the bands with other indicators.
Spotted something inaccurate? Tell us and we will check it and publish a correction.