
What is the RSI indicator? How to use it in forex trading
RSI, short for Relative Strength Index, was published by J. Welles Wilder in 1978.
It measures the speed and size of recent price moves on a scale from 0 to 100. Put simply: how stretched the current rise or fall has become.
This is the indicator we recommend beginners learn FIRST. Not because it is the most accurate, since no indicator is the most accurate.
The reason is that learning RSI also teaches you the idea of momentum, the foundation of the whole oscillator family.
How RSI is calculated: understand it and drop the superstition
RSI(14) compares the total size of the up sessions with the total size of the down sessions over the last 14 sessions.
The formula: RSI = 100 − 100/(1+RS), where RS = average gain ÷ average loss.
When gains dominate, RSI moves towards 100. When losses dominate, it moves towards 0.
That is all there is to it. RSI is a normalised rear-view mirror, not a radar that sees the future. Many wrong uses of RSI start from forgetting this.
Use #1: Overbought and oversold, useful but conditional
The classic reading: RSI > 70 is overbought, < 30 is oversold.
The deadly trap sits in the phrase “sell when overbought”. In a strong trend, RSI can stay above 70 for weeks on end while price keeps rising.
Stepping in to sell just because “it is overbought already” is like headbutting a train. The rules for using it correctly:
- Ranging (sideways) market: overbought and oversold work well, since price touches the edge of the range, RSI reaches an extreme and price bounces back. You can trade the reversal.
- Trending market: use RSI only in the DIRECTION of the trend. In an uptrend, wait for RSI to come back to the 30–40 zone (a price pullback) to BUY MORE, and never sell against the trend just because RSI is high.
The first job is always to set the context with trend and support and resistance; RSI comes second, as a filter.
Use #2: Divergence, when price and RSI move in opposite directions
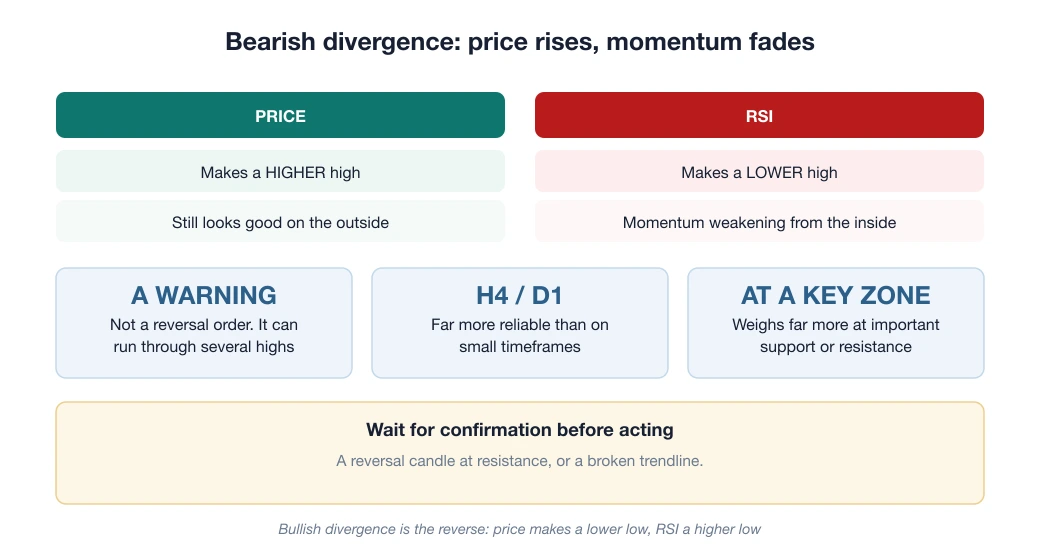
Bearish divergence: price makes a HIGHER high but RSI makes a LOWER high → the upward momentum is weakening from the inside even though price still looks good on the outside.
Bullish divergence: the reverse, with price making a lower low and RSI a higher low. Three notes turn divergence from “interesting” into “usable”:
- Divergence is a warning of weakness, not a reversal order. It can run through several highs or lows before price actually turns. Wait for confirmation (a reversal candle at resistance, a broken trendline) before you act.
- Divergence on larger timeframes (H4, D1) is far more reliable than on small ones.
- Divergence that appears AT an important support or resistance zone carries many times the weight of divergence out in the middle of nowhere.
Use #3: The 50 line, the forgotten trend compass
In a healthy uptrend, RSI usually moves in the upper half, roughly 40 to 80. In a downtrend it stays in the lower half, 20 to 60.
That makes the 50 line a gauge of which side has the ball. RSI holding above 50 through pullbacks is a sign that buyers are still in control.
Use it as a filter: only look for buy trades when RSI on D1 is > 50. That alone removes a whole block of trades against the trend.
A practical setup on MT5 and TradingView
- Default period of 14. Do not rush to “optimise” it down to 7 or 5 for sensitivity; more sensitive means noisier, and every good-looking backtest of the past is tempting. Learn how 14 behaves first.
- Analysis timeframes: establish the trend on D1/H4 → find the entry on H1. The same RSI, read on two levels.
- Sample checklist (combined with what the other articles cover): D1 trend up + price back at support + RSI on H4 climbing out of the 30–40 zone + a confirmation candle → consider buying, stop below support, position size from the formula risk ÷ (stop loss × pip value).
The question that keeps coming up: “Is RSI or MACD better?”
Wrong question. They measure two different things.
RSI measures how stretched the current move is. MACD measures the change in momentum, through the crossover of two moving averages.
Many traders use the pair to complement each other: MACD confirms the direction, RSI times the entry at an extreme stretch. If you also want a volatility band, read on with Bollinger Bands, the third piece of the measuring kit.
Frequently asked questions
At what RSI level should you buy, and at what level should you sell?
By the standard reading, RSI below 30 is the oversold zone (consider buying) and above 70 is the overbought zone (consider selling). This is only a reference signal, though: in a strong trend RSI can stay above 70 or below 30 for a long time, so combine it with the trend and a confirmation signal.
What RSI period should I use?
The default RSI 14 (14 candles) works for many traders and many timeframes. A shorter period (7–9) gives more sensitive signals but more noise; a longer one (21–25) is smoother but slower. Beginners should keep the default of 14.
Is RSI divergence accurate?
RSI divergence is a warning signal worth paying attention to, but it is not absolute: price can keep moving against it for a while before it reverses. Only enter a trade once you have extra confirmation (a reversal candle, a broken trendline), and always set a stop loss.
RSI or MACD: which one should I use?
The two indicators complement each other: RSI measures overbought and oversold, MACD measures momentum and trend. Many traders use both, RSI to find potential turning points and MACD to confirm momentum. See our article on the MACD indicator for details.
Spotted something inaccurate? Tell us and we will check it and publish a correction.