
What is the MACD indicator? How to read and trade it
MACD, short for Moving Average Convergence Divergence, was developed by Gerald Appel in the 1970s.
It tracks how two moving averages converge and diverge, which tells you whether the momentum of a trend is getting stronger or weaker.
If RSI is the gauge of how stretched price is, MACD is the gauge of acceleration.
The image at the top of this page sets out all three parts. Keep it in view as you read each section below.
Anatomy of MACD: three parts, three stories
- The MACD line = EMA(12) − EMA(26): the gap between the fast and the slow exponential moving average. When the two averages spread apart (MACD rising), the trend is speeding up; when they close in, it is running out of breath.
- The Signal line = EMA(9) of the MACD line itself, a smoothed version that runs one beat behind so that the two lines can cross.
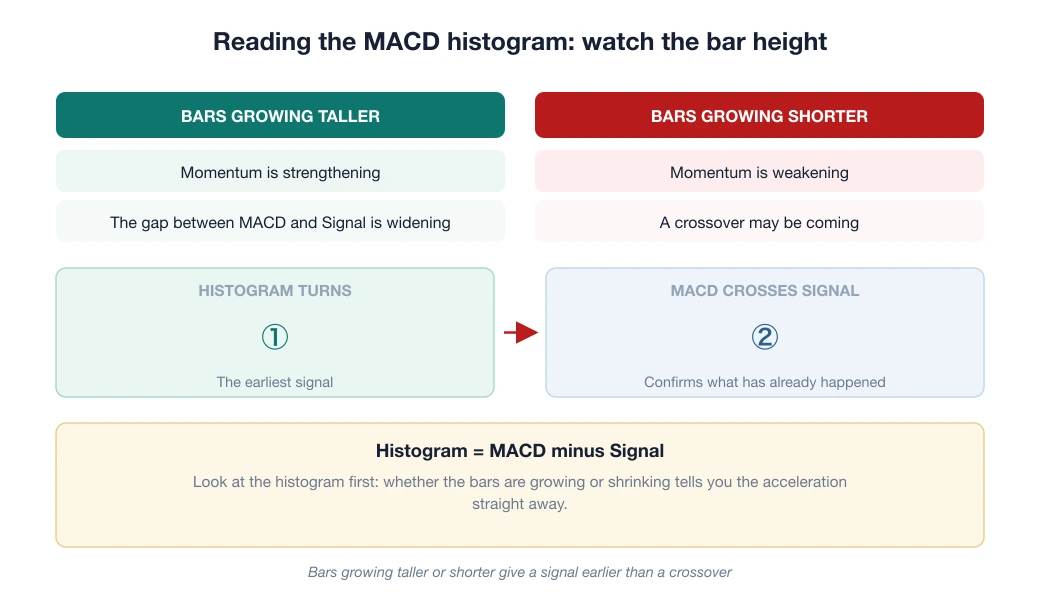
- The histogram = MACD − Signal: bars getting taller mean momentum is strengthening; bars getting shorter mean it is weakening. This is the most sensitive part, and also where the earliest signal appears.
The histogram changes direction before the two lines cross, so look at it first: whether the run of bars is growing or shrinking tells you the “acceleration” straight away.
Signal #1: the MACD/Signal crossover, a signal that always arrives after price
MACD crossing ABOVE the Signal line means momentum is turning up; crossing BELOW means it is turning down. But a beginner needs to hear two facts early:
- In a sideways market crossovers fail again and again: the two lines tangle like noodles and cross back and forth, and each cross is a small losing trade. MACD is a TREND indicator, so only trade crossovers when the market really is trending (check the swing high and low structure explained in our introduction to technical analysis).
- A crossover is a lagging signal. It confirms what has already happened. It works better as a direction filter (“only buy while MACD is above Signal”) than as the button that puts you in a trade.
Signal #2: where MACD sits against the zero line, a filter for “which side is in control”
MACD above 0 means EMA12 > EMA26, so the moving average structure favours the upside. Below 0, it favours the downside.
A clean way to use it: on the daily (D1) chart, only look for BUY trades while MACD > 0, and only look for SELL trades while MACD < 0.
One line of rules removes a whole basket of trades against the trend. For a beginner, this is where MACD earns its keep, more than in crossovers.
Signal #3: MACD divergence, slower than RSI but more “solid”
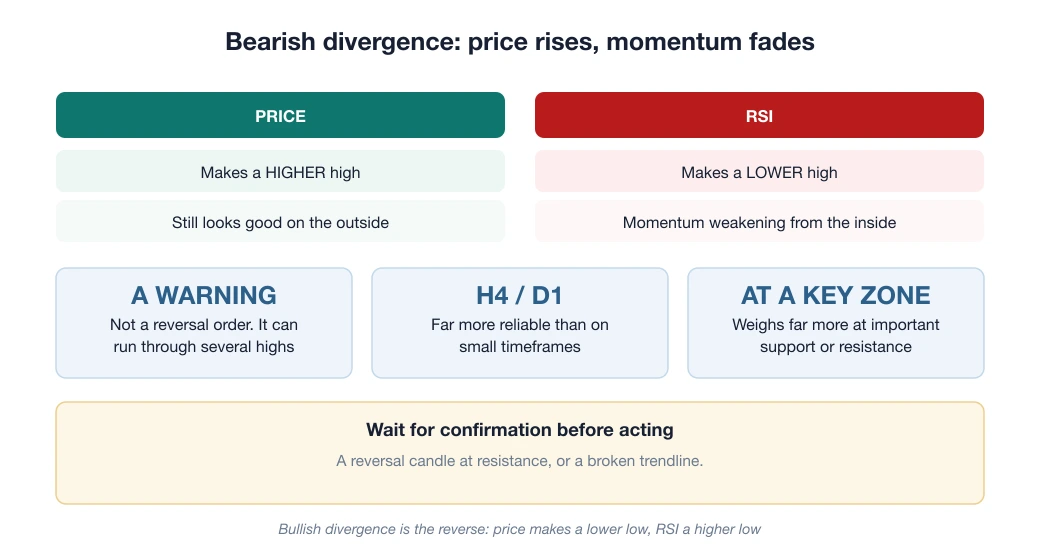
It works just like RSI divergence: price makes a higher high but MACD or the histogram makes a lower high, meaning the rally is hollow inside.
Because MACD is built from moving averages, it is smooth and carries little noise. Its divergences appear less often than RSI’s, but each one tends to be more reliable, especially histogram divergence on the 4-hour (H4) and D1 charts at a major resistance zone.
A rule that does not change: divergence is a yellow light, not a red light. Wait for price to confirm with a trendline break or a reversal candle before you act.
Three common MACD mistakes (and the fix in one sentence)
- Trading every crossover regardless of context → only trade crossovers that go with the bigger trend and happen at a price zone that matters.
- Expecting MACD to catch bottoms and tops → MACD was built to FOLLOW trends, not to catch turning points; if you want to time the extremes, RSI or Bollinger Bands suit the job better.
- Tweaking 12-26-9 into “optimal” settings after one backtest → the standard settings are valuable because many people watch them; your own settings are only optimal for the past.
Putting MACD into a system: an example of a complete checklist
- D1: a rising high and low structure + MACD > 0 → hunt for buys only.
- Price pulls back to support or a Fibonacci zone (see Fibonacci retracement).
- H4: the histogram shrinks towards 0, then turns up (the selling momentum has run dry) + a confirming candlestick pattern.
- Enter, place the stop below support, size the trade with the formula risk ÷ (stop loss × pip value), and risk 1–2%.
Four steps, each tool with its own role, none stepping on another’s toes. That is how indicators should be used: as an orchestra, not as a solo.
Frequently asked questions
When MACD crosses above the Signal line, is that a buy or a sell?
When the MACD line crosses above the Signal line, it is a buy signal (momentum turning up); crossing below it is a sell signal. This signal fails easily in a sideways market, though, so combine it with the bigger trend and with support and resistance zones.
What are the best MACD settings?
The default set (12, 26, 9) designed by Gerald Appel is still a sensible place to start. Changing the settings to “fit” the past usually leads to over-optimisation that stops working in the future. Beginners should keep the default.
What is the MACD histogram used for?
The histogram shows the gap between the MACD line and the Signal line, reflecting how strong momentum is. A histogram that is expanding means momentum is strengthening; one shrinking towards 0 signals that momentum is weakening and a crossover may be close.
Which is better, MACD or RSI?
Neither is “better”; they measure two different things. RSI measures overbought and oversold conditions, MACD measures momentum and trend. Using the two together usually gives more reliable signals than using either one alone.
Spotted something inaccurate? Tell us and we will check it and publish a correction.