
What is Fibonacci retracement? How to draw and trade it
Fibonacci retracement answers one very specific question for a trend trader: the price is pulling back, so where will it fall to before it moves on?
The tool divides the last wave by the ratios 23.6% · 38.2% · 50% · 61.8% · 78.6%, then treats each one as a possible station where the pullback may stop.
The opening image holds the whole idea: a wave up, a pullback to the 61.8% station, then the trend carries on.
Where it comes from, and the plain truth about the “golden number”
These ratios come from the Fibonacci sequence: 1, 1, 2, 3, 5, 8, 13 and onwards, each number the sum of the two before it. The ratio of two consecutive numbers tends towards 0.618, the inverse of the golden ratio 1.618, a number that turns up all over nature. And the mysticism stops there.
The reason Fibonacci works in trading is far more mundane. A great many traders and algorithms draw it on the same wave, watch the same 0.618 level and place orders around it. A shared expectation fulfils itself.
Once you see that, you use Fib as a probability tool instead of trusting it like a lucky charm. You also see why it is useless in a sideways market with no clear waves.
How to draw it properly, and two mistakes that skew every Fib level
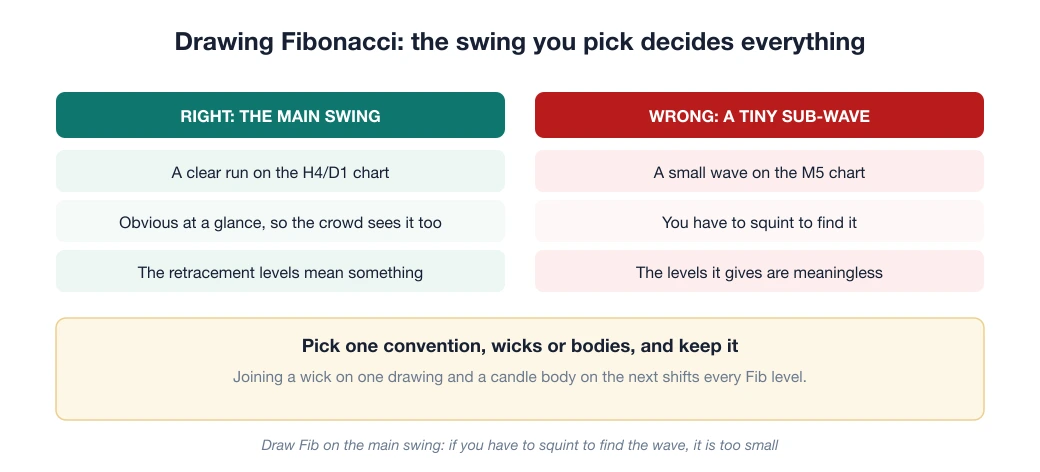
- Pick the main swing on the H4/D1 chart: one clear run from the swing low to the swing high. The swing has to be “obvious at a glance”. If you have to squint to find it, it is not big enough for the crowd to see it too.
- Drag the Fib tool from the low to the high (an up wave) or from the high to the low (a down wave). On MT5: Insert → Objects → Fibonacci Retracement; on TradingView: the shortcut Alt+F.
- Read the levels: 0% is the top of the wave, 100% is the bottom, and the levels in between are where the price may stop during a pullback. A pullback of 23.6–38.2%: a very strong trend. A pullback of about 50–61.8%: a “textbook” correction, the favourite zone for hunting entries. A break through 78.6%: the wave structure has a problem, and it is likely no longer a correction but a reversal.
The classic mistakes: drawing Fib on a tiny sub-wave on M5, or joining candle wicks and candle bodies inconsistently. Pick one convention (usually the wicks) and keep it for good.
A trading strategy around Fib 0.618: a complete example
The scenario from the opening image, turned into a real trade:
- The D1 trend is up (a structure of higher highs and higher lows, see the foundation article on technical analysis). The price has just made a new high and started to pull back.
- Draw Fib on the most recent wave. Wait, and do not guess in advance which level the price will stop at.
- The price reaches the 50–61.8% zone and a confirmation candle appears (a Hammer, a Bullish Engulfing). It is especially valuable when the Fib level LINES UP with an old support or a trendline (confluence: two independent reasons pointing at one price zone are more trustworthy than one).
- Enter a buy; place the stop loss below the 78.6% level (where the “correction” scenario is officially wrong); take profit at least at the old high (0%), with a reward-to-risk ratio usually of 2:1 or better. Work out the position size with the formula risk ÷ (stop loss × pip value).
Fibonacci extension answers “where do I take profit?”
The sibling of the retracement is the Fibonacci Extension (127.2%, 161.8%…), which projects the target of the NEXT wave once the price has broken the old high. The pair, retracement to find the entry and extension to find the exit, makes a complete framework for a trend trader.
Three things Fibonacci cannot do for you
- A Fib level is a zone, not a line drawn to the millimetre. Price poking slightly through 0.618 and coming back is normal, so give it room to breathe when you set the stop.
- Without a confirmation candle a Fib level is just a pretty line. Fib marks the zone, the candle pulls the trigger, and with either one missing there is no trade.
- In a very strong trend the price may pull back only 23.6% and run on, and waiting forever at 61.8% means missing the train. Read the strength of the wave with RSI/MACD to choose the right station.
Frequently asked questions
Which Fibonacci level matters most?
The 0.618 (61.8%) level, the inverse of the golden ratio, is seen as the most important, together with 0.382 and 0.5. These are the price zones where a pullback within a trend often turns.
Where do you draw Fibonacci retracement from and to?
In an uptrend, drag from the bottom to the top of the up wave; in a downtrend, drag from the top to the bottom. Only a large, clear swing makes the retracement levels meaningful.
Is Fibonacci retracement accurate?
Fibonacci is a probability tool, not an absolute one. It works best when it lines up with a support or resistance zone or a candlestick pattern (confluence) and has a confirmation signal. Always set a stop loss, because the price can break through any level.
Spotted something inaccurate? Tell us and we will check it and publish a correction.