
What are chart patterns? Six key patterns in forex
Price patterns are the recurring shapes that price draws over dozens of sessions: head and shoulders, double tops, triangles.
If Japanese candlesticks are the vocabulary, price patterns are whole paragraphs. They tell the story of a long tug of war between buyers and sellers, and they usually end with a breakout you can trade.
The three patterns below are read with the same framework: the story, how to spot it, how to trade it.
1. Head and shoulders, the most classic reversal pattern at a top
The story: buyers push price to a peak (the left shoulder), then to a higher peak (the head), and they still look strong.
But the third push only reaches a LOWER peak (the right shoulder). For the first time in the whole trend, buyers cannot make a new high. The structure of higher highs and higher lows has broken from the inside.
Spotting it: three peaks with the middle one highest, plus a neckline joining the two troughs between them. The neckline can slope slightly; it does not need to be perfectly flat like in a textbook.
Trading it: the signal only triggers when a candle closes below the neckline. Before that the pattern is not complete, and guessing early is a bet.
The classic target is the distance from the head to the neckline, projected down from the breakout point. The stop goes above the right shoulder.
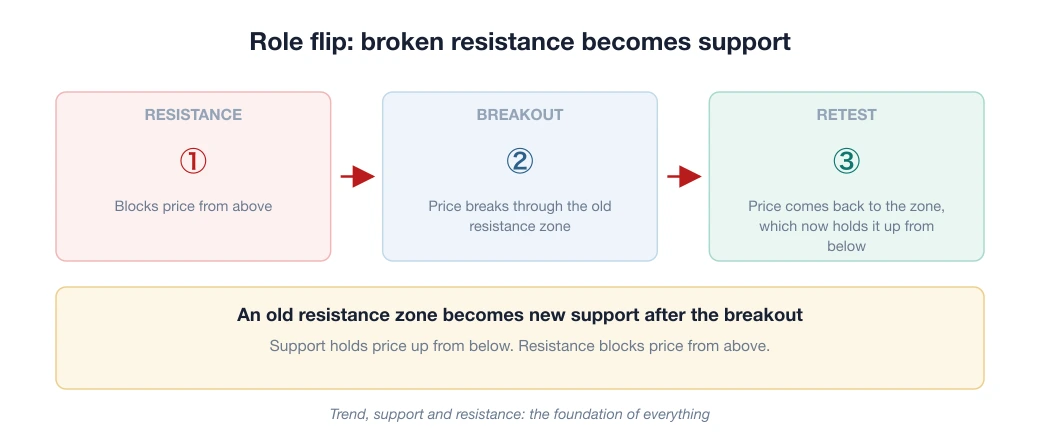
After the breakout, price often comes back to touch the neckline before it really falls. That retest is a good second entry for anyone who missed the first move, with confirmation from a reversal candle.
2. Double top: the warning M
The story: price makes a peak, pulls back, rises again and gets rejected in exactly the same zone. Buyers run out of money at that level, twice. The top zone becomes a confirmed wall.
Spotting it: two roughly equal peaks forming an M (a small gap between them still counts, so look at the ZONE and do not demand a touch to the millimetre). The neckline is the trough between them.
You trade it the same way as head and shoulders: wait for a candle to close through the neckline, target the height of the pattern projected down, and put the stop above the second peak.
Its mirror image is the double bottom, a W shape that appears at the bottom of a downtrend with exactly the opposite logic.
A note on probability: double tops show up VERY often, and many of them never complete. Price does not break the neckline and simply carries on.
No breakout means no pattern, and no pattern means no trade. This discipline of waiting filters out a lot of premature trades.
3. Ascending triangle: a continuation pattern
The story: there is flat resistance above (sellers patiently unloading at one price), but the lows keep getting HIGHER (impatient buyers getting in earlier and earlier). Pressure builds on one side, like a crowd edging towards a door.
Spotting it: a horizontal resistance line and a rising support line converge. Volume usually dries up inside the triangle.
Trading it: enter on a candle that closes above resistance. The odds usually lean towards an upside break, but not absolutely, so you still wait for the close.
The target is the base of the triangle projected upwards. The stop goes below the nearest low inside the triangle.
There are two variants: a descending triangle breaks down, and a symmetrical triangle is neutral, so you follow whichever way it breaks.
Four principles for EVERY price pattern
- No breakout = no pattern. However nicely it is drawn, it is only potential. A candle closing outside the boundary is the event.
- Bigger pattern on a bigger timeframe = more reliable. A head and shoulders that forms over 2 months on the daily chart (D1) carries far more weight than one that forms over 2 hours on the 5-minute chart (M5).
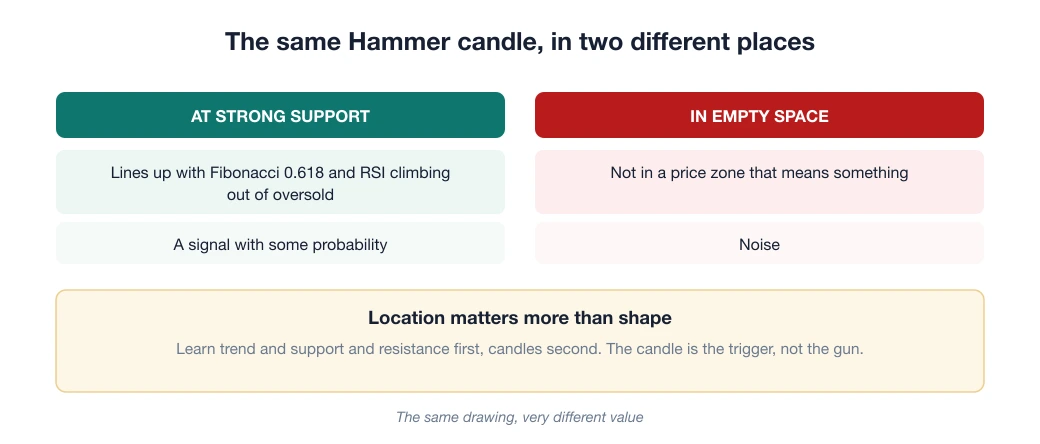
- Confluence multiplies strength: a neckline that lines up with old support, a triangle top that lines up with the Fibonacci 0.618 level (the Fibonacci article), a breakout while MACD changes phase. The more independent evidence you have, the higher the probability.
- Patterns give you a natural invalidation point, so the stop loss is already built into the structure (above the right shoulder, above the second peak, below the triangle low). Respect it, size the trade with the formula risk ÷ (stop loss × pip value), and let probability do the rest.
You have now walked the full foundation path: trend → candles → indicators (RSI, MACD, Bollinger) → Fibonacci → price patterns.
What remains is not learning more tools. It is picking the 2–3 that suit you, combining them into a checklist, and repeating it over a full 100 trades with a journal.
Frequently asked questions
Which price pattern is easiest for beginners?
The double top and the double bottom are the easiest to spot, with clear M and W shapes. Beginners should get comfortable with these two and with head and shoulders before learning more complex patterns.
What does a head and shoulders pattern signal?
Head and shoulders (three peaks, the middle one highest) signals a reversal from up to down when price breaks the neckline. The opposite pattern, the inverse head and shoulders, signals a reversal from down to up.
Should I enter a trade as soon as I see a price pattern?
No. Wait for price to break out of the pattern, confirmed by a candle close, to avoid false breakouts. Combine it with volume, Fibonacci or an indicator, and always set a stop loss.
Spotted something inaccurate? Tell us and we will check it and publish a correction.